How the MyImpactStyle assessment works.
A short, honest tour of the assessment’s research design: the question structure, the scoring math, the hidden dimensions that power the underlying dataset, and the validation gates that have to pass before we’ll show a result to anyone.
The volunteer-motivation literature is scattered. The field needs a shared language.
For four decades, volunteer-motivation research has split the question across roughly six factors: Values, Understanding, Career/mastery, Social, Protective, and Enhancement in the Volunteer Functions Inventory tradition. The literature is sound, but it lives in academic journals. It does not give a volunteer language for who they are, and it does not give a coordinator a way to talk about the difference between two volunteers in front of them.
The MyImpactStyle framework is volunteer-native. It re-organizes the underlying motivation literature into six recognizable styles (Champion, Companion, Anchor, Builder, Explorer, and Catalyst) that map cleanly onto the existing factors but read like personalities, not variables. That makes the result shareable in a way the underlying research never has been.
Nineteen questions. Two formats. Roughly five to six minutes.
The assessment has fifteen ipsative (forced-choice) questions and four Likert (4-point scale) questions, in the order Q1–Q15 (forced-choice) followed by B1–B4 (the four Connection ratings). Each ipsative question shows four statements; the respondent picks the one most like them and the one least like them. The other two are unmarked.
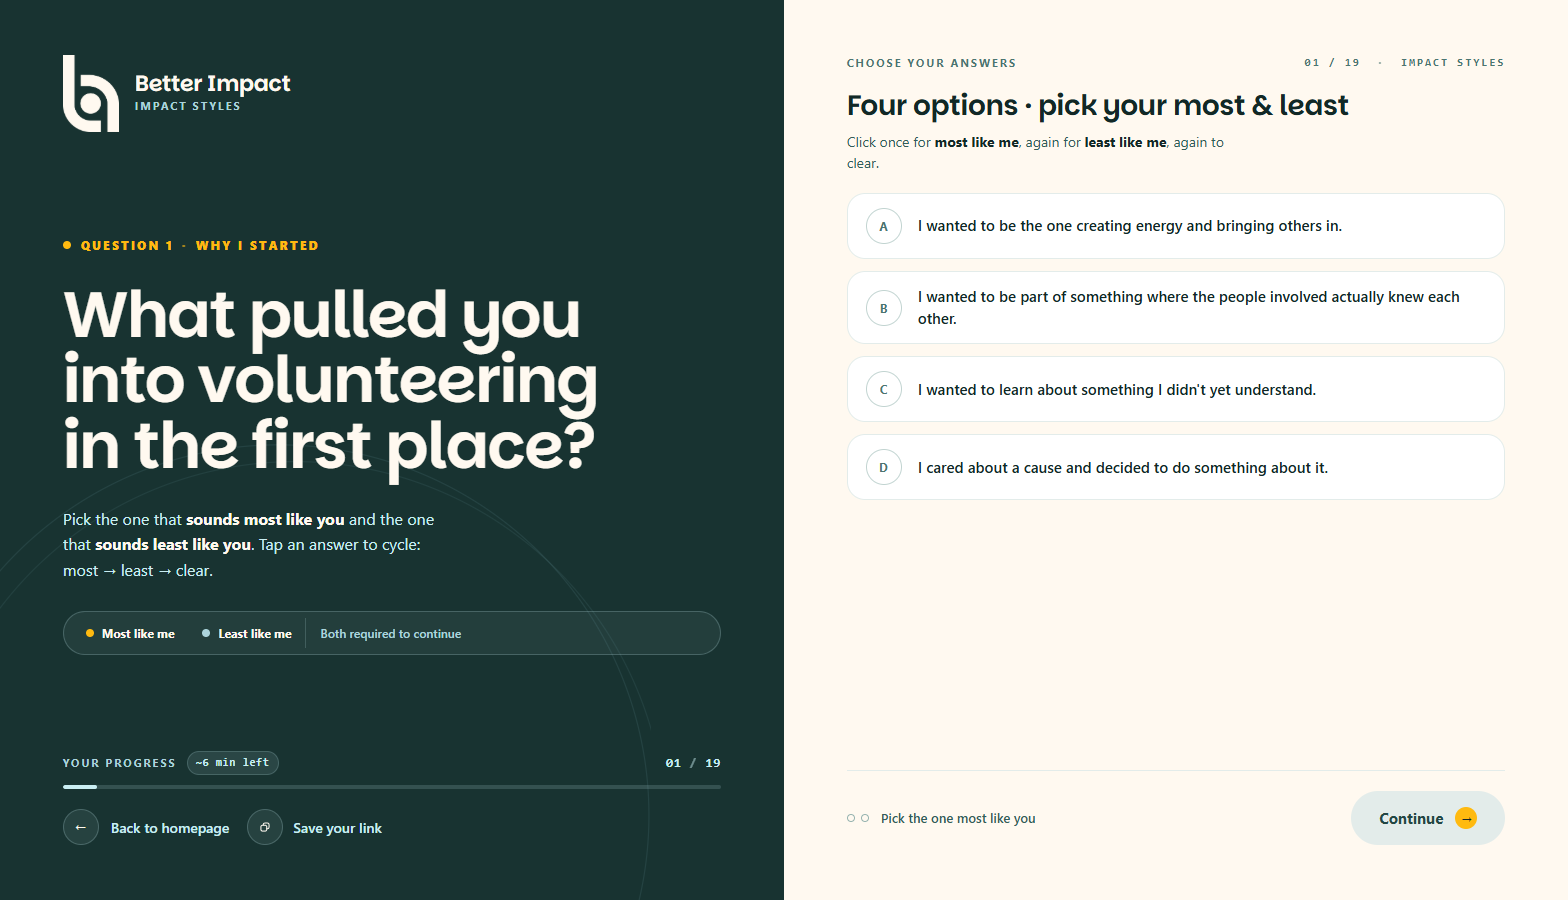
Ipsative scoring is the design choice that distinguishes this assessment from social-desirability-prone Likert scales. By forcing the respondent to differentiate between four statements they all agree with at some level, the resulting profile reflects relative emphasis rather than uniform agreement. It’s the same statistical posture used by DISC and the Wonderlic Personality Inventory, both well-validated and resistant to faking.
Statement coverage is mathematically symmetric. Each question shows 4 of the 6 styles. Across 15 questions, every style appears in exactly 10 questions and every pair of styles appears together exactly 6 times. There is no scoring bias possible from question design alone; we verified this with a 1,000-trial Monte Carlo simulation under uniform random input (see Validation, below).
Statement order is randomized per respondent using a session-token-seeded shuffle. Two respondents on the same question see the four statements in different orders, so position bias is eliminated even if it exists.
Most picks add 2. Least picks subtract 1. Unmarked statements add nothing.
For every ipsative question, the style picked as MOST receives +2 points and the style picked as LEAST receives −1. The two unmarked statements receive zero. After 15 questions, each of the six styles has a raw integer score in the theoretical range −10 to +20.
The respondent’s primary style is the one with the highest raw score. The secondary style is second-highest. Tie-breaking follows a deterministic chain: more total MOST picks wins, then fewer total LEAST picks wins, then a cross-axis distance proxy, then alphabetical (which is vanishingly rare given the question bank’s symmetry).
The four Likert items, grouped at the end of the assessment, measure the Bridging Index, the only research dimension surfaced to the respondent (as “Connection Reach”). Each item is a 4-point scale with no neutral midpoint, intentionally forcing commitment. The four values (each 1–4) sum to a total of 4–16, normalized to the 0–100 range with the formula ((sum − 4) / 12) × 100.
Three research-only metrics that power the underlying dataset.
Three numerical dimensions are computed alongside the visible result and stored in the research dataset, but never shown to the respondent and never returned in any public API. They exist to support the eventual State of Volunteer Service report and the underlying sociological work the assessment is designed to enable.
Service Orientation Score (SOS)
0–100, hiddenA weighted sum derived from per-statement tags (Strongly Connected / Moderately Connected / Neutral / Transactional). SOS captures whether the respondent's volunteer instincts skew relational versus transactional, independent of which of the six styles they ended up as. Bands: 0–34 Pragmatic, 35–64 Mixed, 65–100 Connected/Relational.
Bridging Index (BI)
0–100, surfaced as Connection ReachMeasures cross-difference contact: how much the respondent's volunteer experience has put them across age, background, language, or belief from the people they serve. Built directly from the four Likert items B1–B4. The only hidden dimension surfaced in the user-facing result. Bands: 0–34 Lower, 35–64 Moderate, 65–100 High Connection Reach.
Identity Score (IS)
0–100, hiddenCounts identity-coded statements picked as MOST. Captures the degree to which the respondent has internalized volunteering as identity rather than activity (the academic literature calls this 'role identity'). Strongly correlates with long-term retention. Bands: 0–29 Service as Activity, 30–59 Forming, 60–100 Service as Identity.
What has to pass before we'll show a result to anyone.
Before launch the scoring engine has to clear a 1,000-trial deterministic Monte Carlo simulation. Under uniform random input, every primary style appears between five and forty percent of trials, every hidden dimension has a standard deviation of at least five (so no metric is degenerately stuck at a single value), and every dimension’s 5th-percentile result is below the midpoint while its 95th-percentile result is above it (so the full 0–100 display range is reachable in practice).
Current Monte Carlo distribution (1,000 trials, deterministic seed):
Primary style distribution    (uniform random → expect ~167 each):
  champion    184   18.4%
  companion   165   16.5%
  anchor      160   16.0%
  builder     169   16.9%
  explorer    161   16.1%
  catalyst    161   16.1%

Hidden dimensions  (mean / std / p10 / p50 / p90):
  SOS        62.6    13.1    46    63    79
  Bridging   49.8    18.6    25    50    75
  Identity   31.4    15.7    13    25    50

Tiebreaker fired in 141 of 1,000 trials (14.1%).
Property-based testing. A fast-check property suite (200 random valid 19-answer sets per property) verifies that every per-style score lands in [−10, +20], the Bridging Index always lands in [0, 100], primary and secondary are always distinct, the engine is deterministic, and permuting the answer order yields identical results.
What we're confident about. What we're not.
What we’re confident about. The question bank’s mathematical symmetry guarantees the engine produces an unbiased distribution under uniform random input. The Monte Carlo gate confirms this empirically. The privacy posture is defense-in-depth: hidden dimensions live in the database for research export only, never in any user-facing API, and the smoke test asserts this on every release.
What we’re not yet confident about. Test-retest reliability targets ≥80% for primary type with the same respondent re-taking the assessment after seven days. We’ll publish observed reliability once the dataset reaches 1,000 completions. Convergent validity with the Volunteer Functions Inventory and Big Five is on the post-launch research roadmap. The Catalyst style does not map cleanly to a single VFI factor and represents a hybrid; we’ll publish a discussion of where it fits in the existing literature when the first paper is ready.
Anonymous by design. Hashed at the boundary. Researched in aggregate.
No login, no email, no account. Session tokens are 16-character random strings (32¹² entropy) and are the only handle on a respondent’s data. Raw IP addresses are never persisted; only a one-way SHA-256 hash with a per-deployment salt that is rotated on a schedule. User-Agent is recorded for bot detection only and purged on a 30-day rolling job.
No third-party analytics, advertising pixels, or AI services on this site. See the full privacy notice for our security posture and the right-to-deletion endpoint.
Research outputs are aggregated and anonymized. No respondent will ever be individually identifiable in The State of Volunteer Service report or any subsequent publication.
Take the assessment yourself.
Five to six minutes. Nineteen questions. Anonymous. Your data quietly contributes to the research described above.
A research initiative of Better Impact and MyImpactStyle. Free, anonymous, open forever.